Plot on the sides of a cube
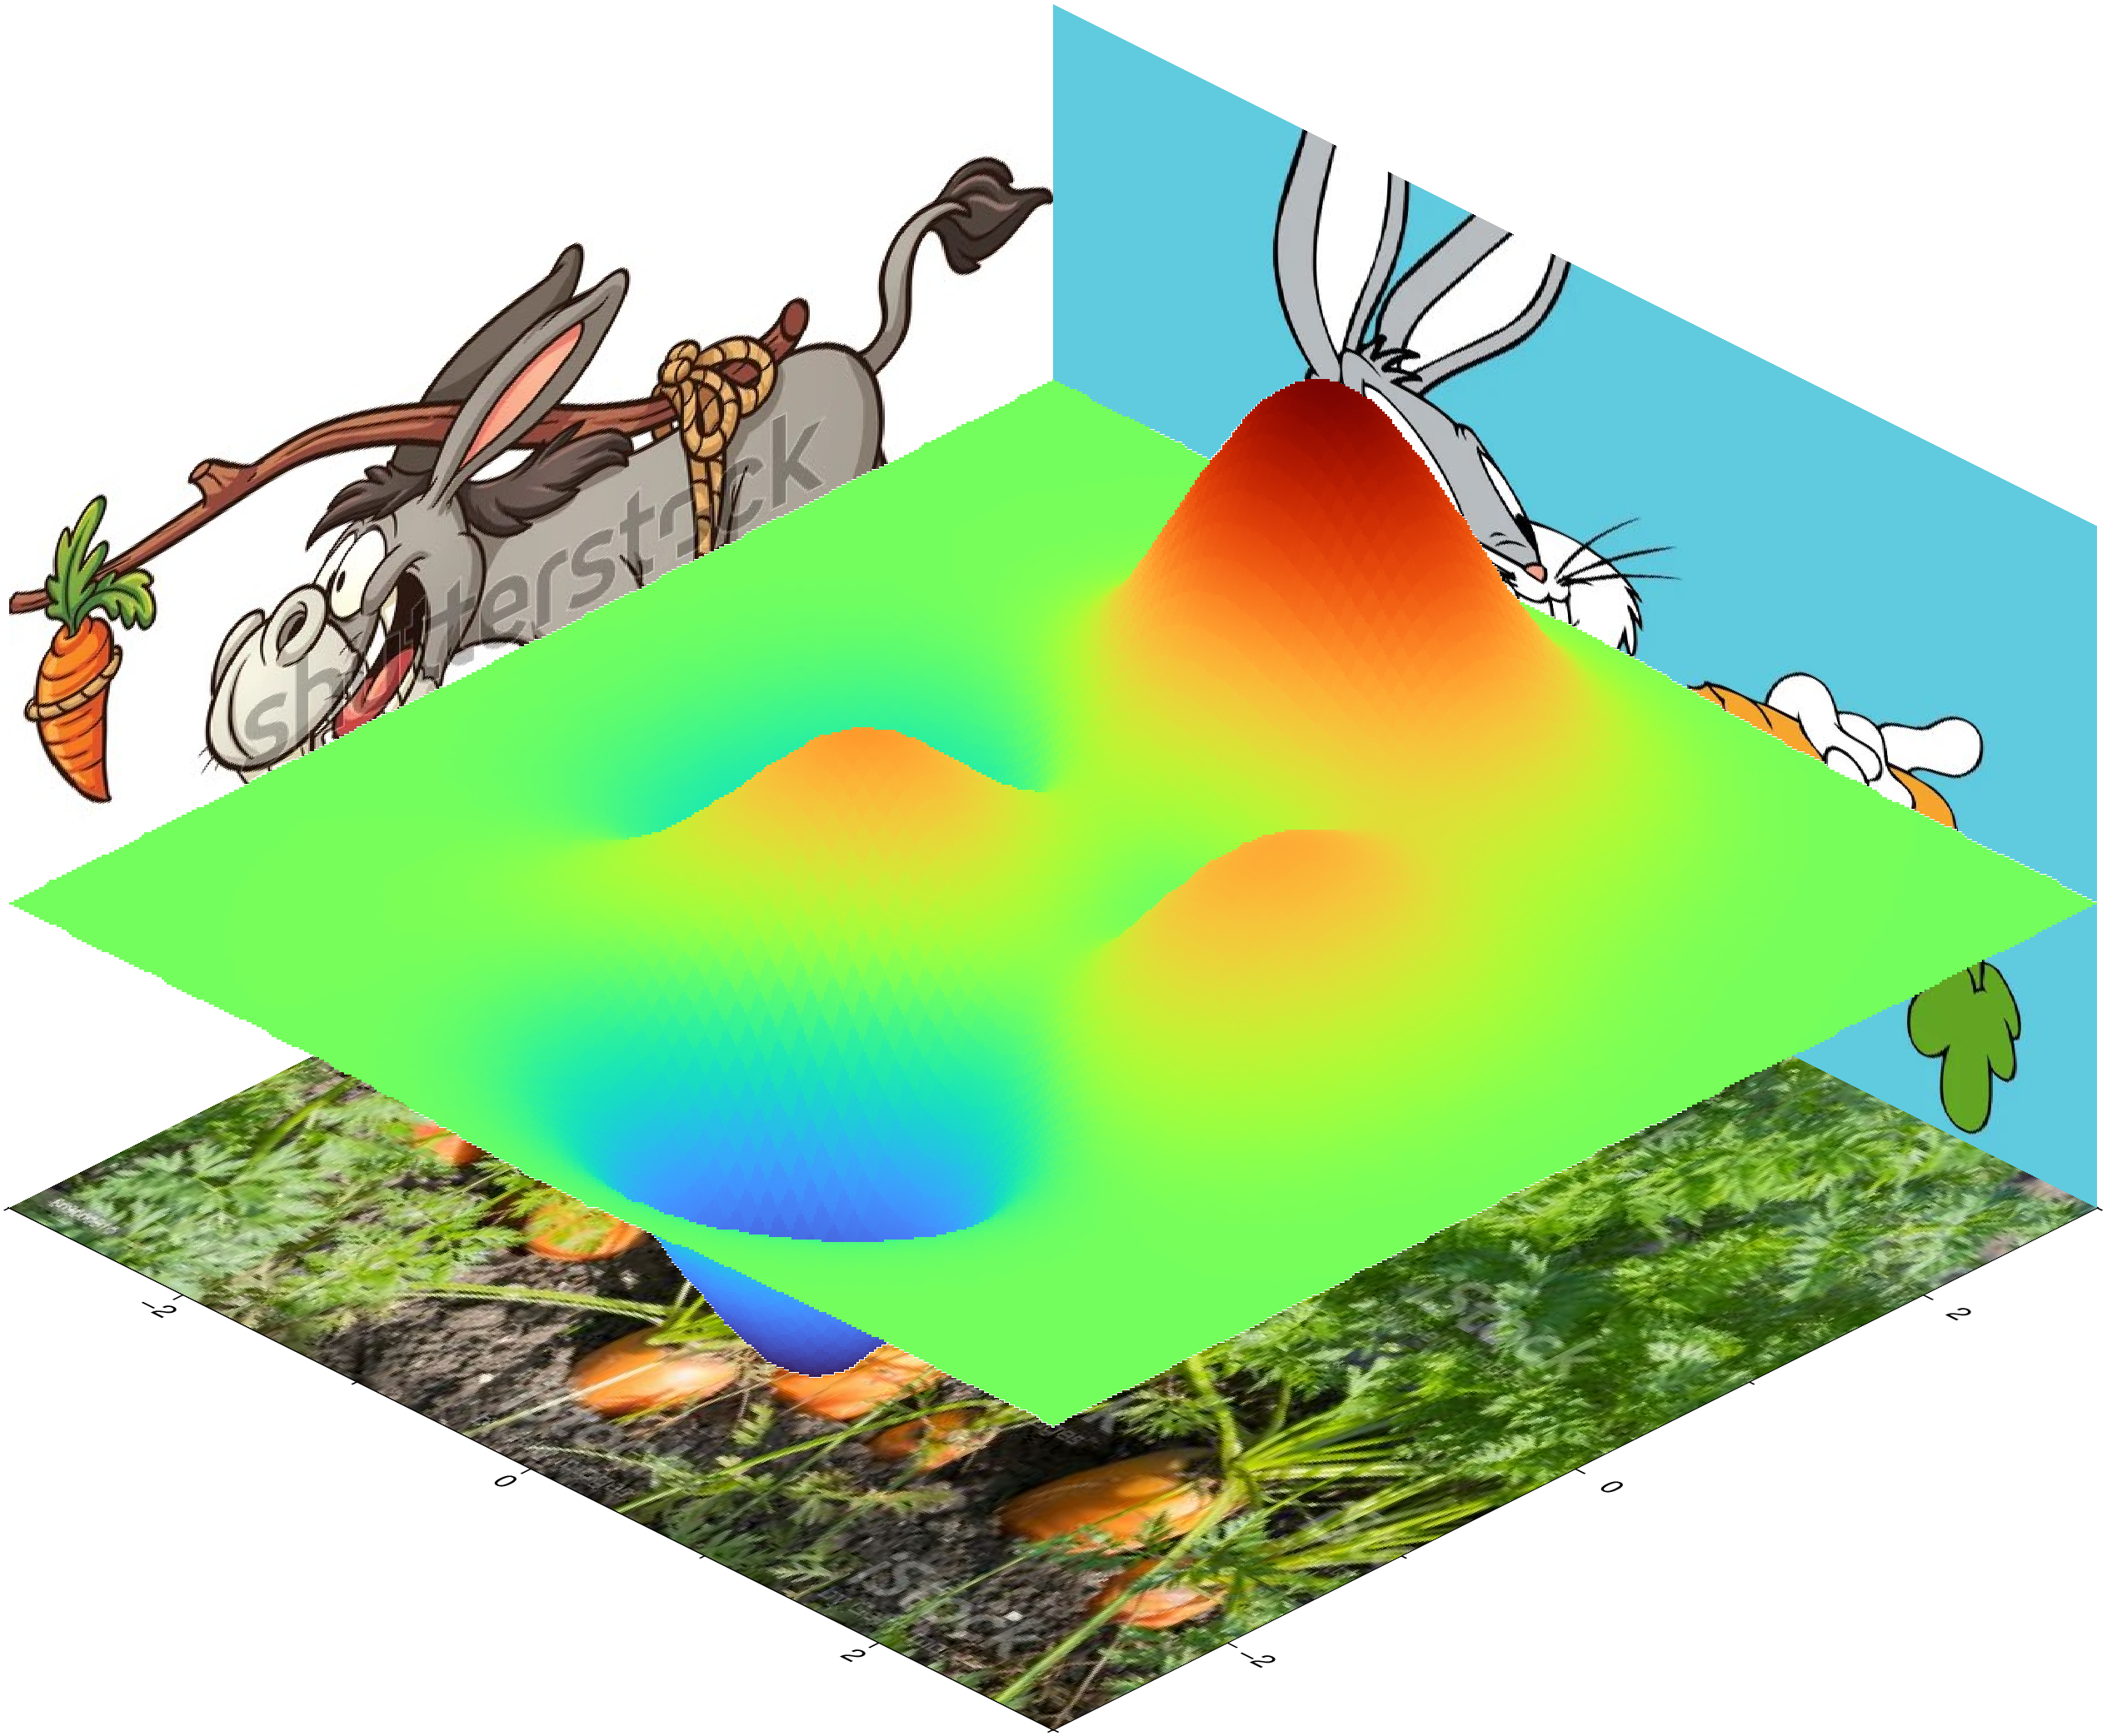
This example shows how we can plot images on the sides of a cube. We can print them either on the back side and use the left available space to plot another thing, as in:
using GMT

viz(GMT.peaks(N=100), zsize=8, facades=(GMT.TESTSDIR * "assets/cenora_base.jpg",
                                        GMT.TESTSDIR * "assets/bunny_cenora.jpg",
                                        GMT.TESTSDIR * "assets/burro_cenora.jpg"))
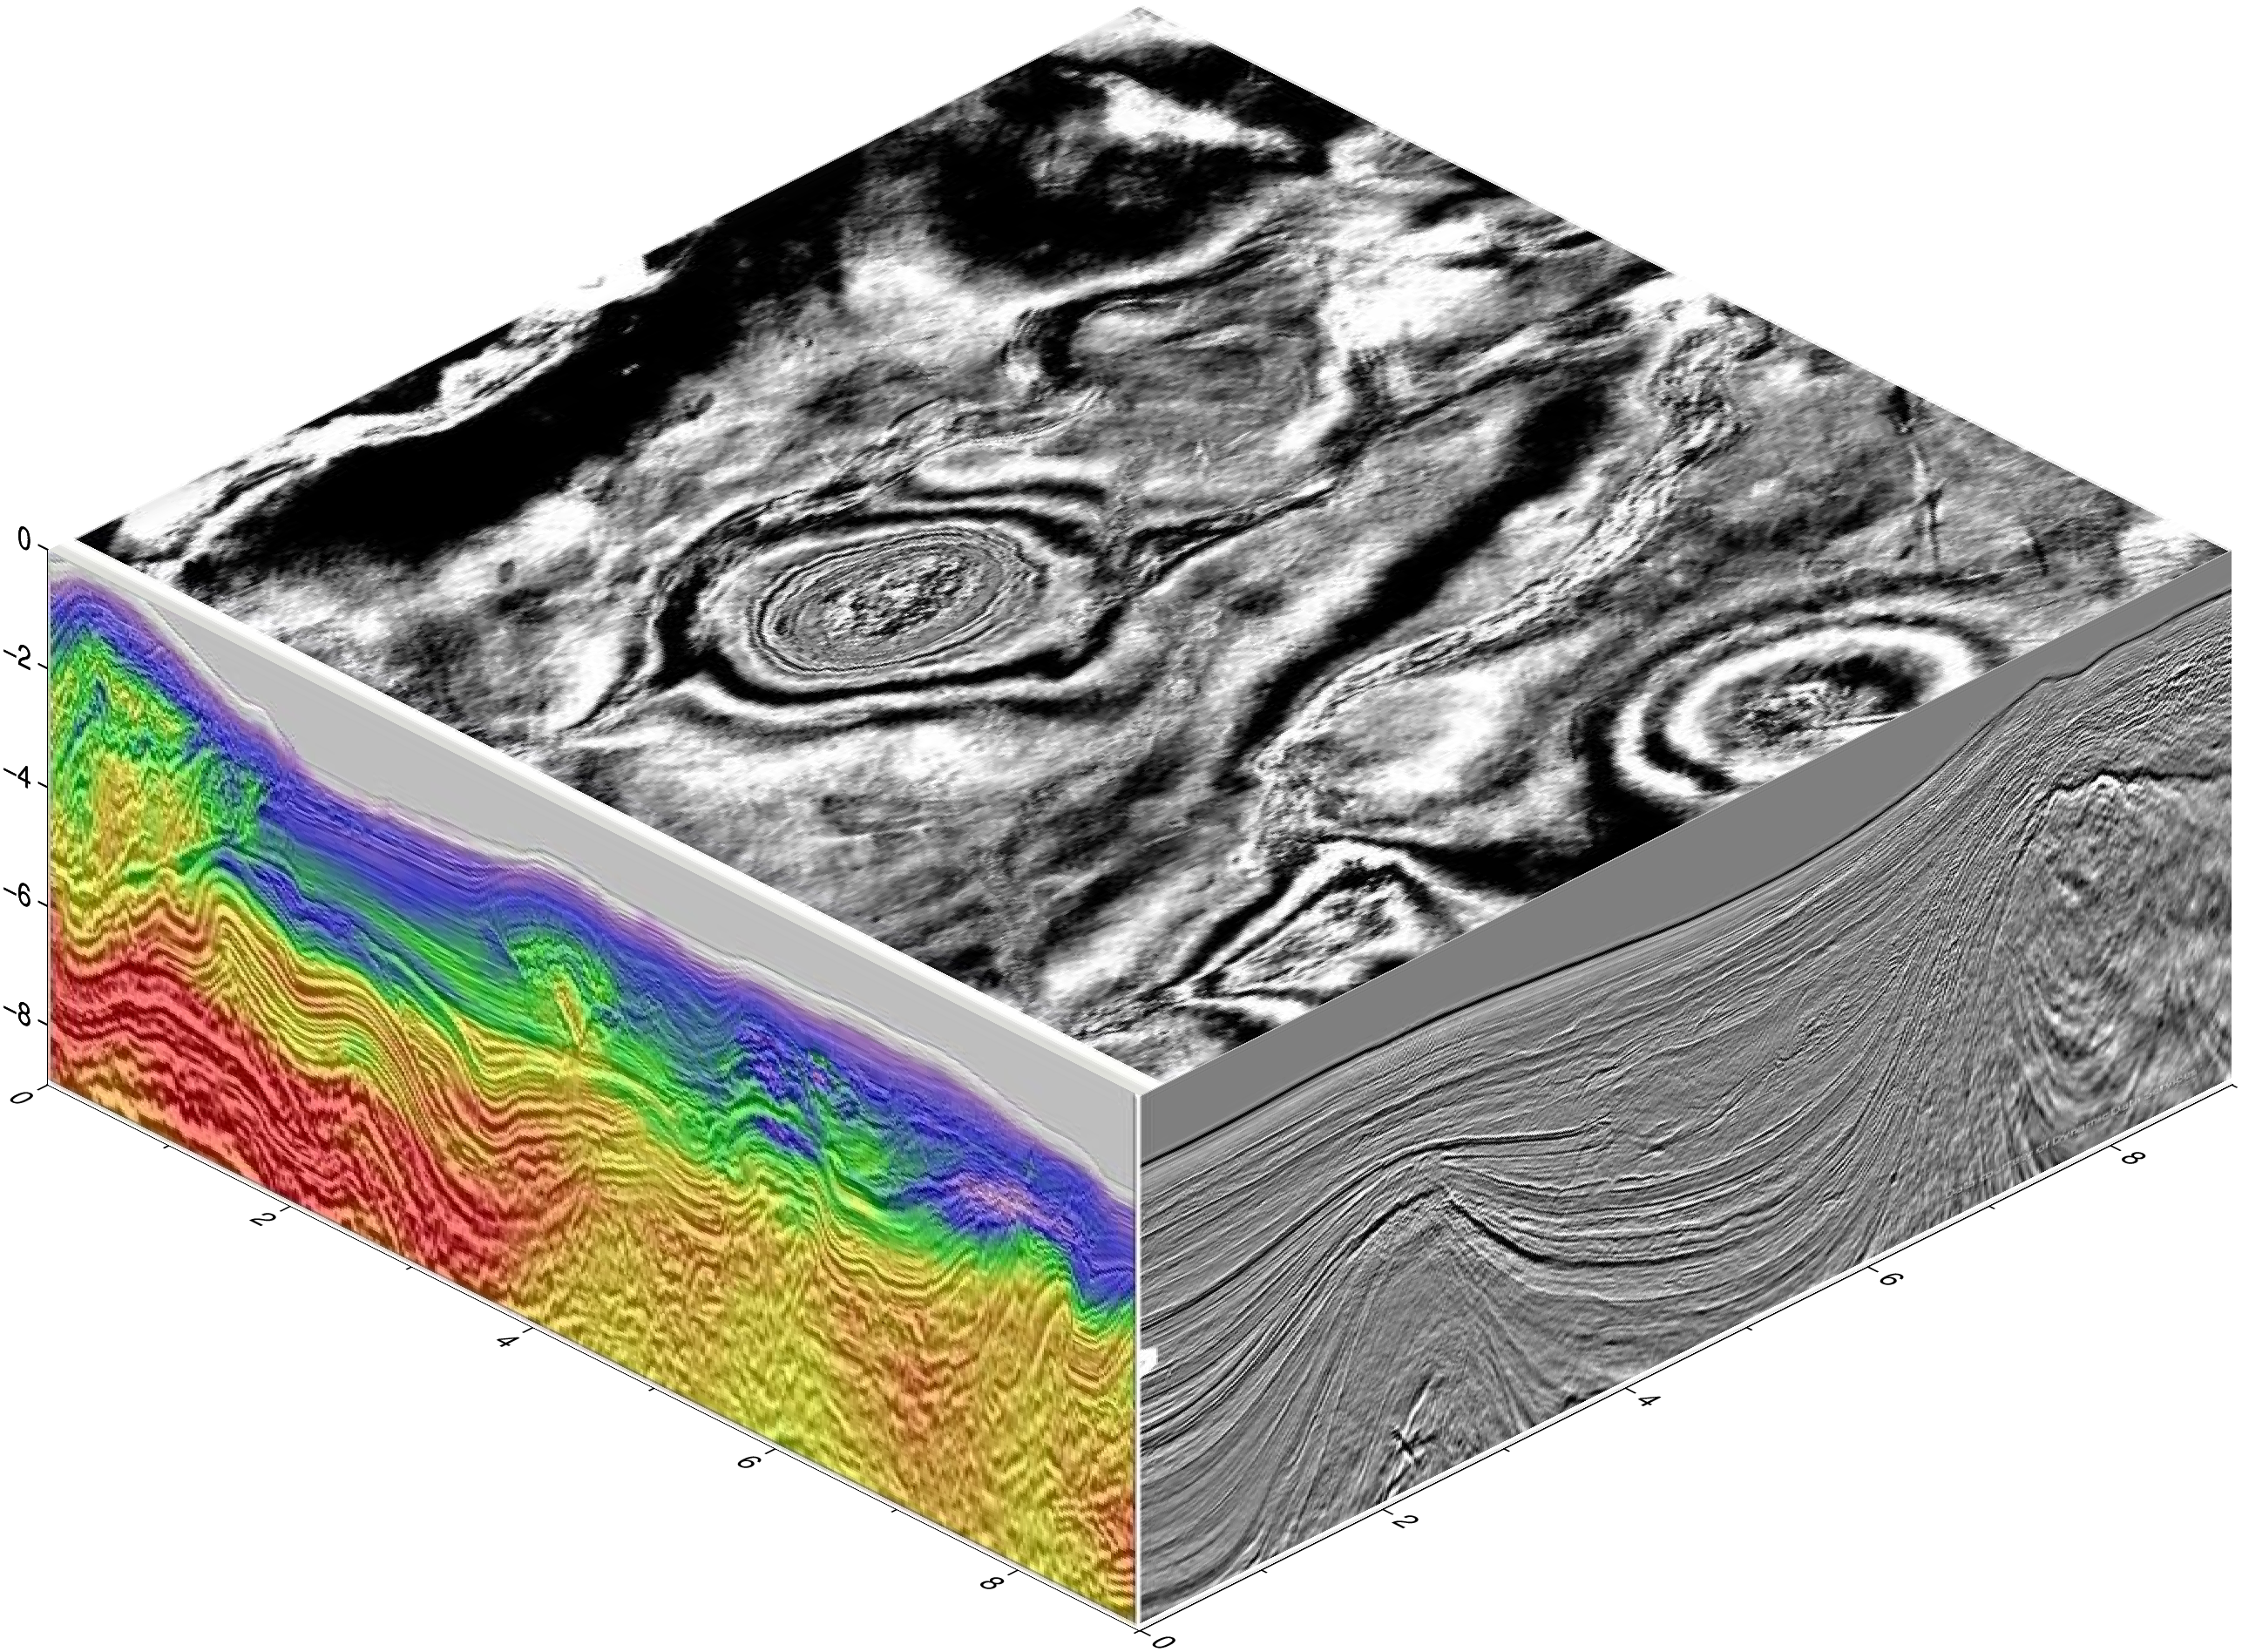
The above example used the helper function imshow (well, its alias viz) that knew what to do when it found the keyword facades, but in fact the work was done by the function cubeplot. Next example shows how to call that function directly to plot three images in the front sides of the cube.
cubeplot(GMT.TESTSDIR * "assets/seila_gray.jpg",
         GMT.TESTSDIR * "assets/seis_section_rgb.jpg",
         GMT.TESTSDIR * "assets/seis_section_gray.jpg",
         zsize=6, show=true)
© GMT.jl. Last modified: January 10, 2025. Website built with Franklin.jl and the Julia programming language.
These docs were autogenerated using GMT: v1.33.1